← Back to projects Final Year Project

PowerPulse – Cloud Based Smart Energy Monitoring Platform

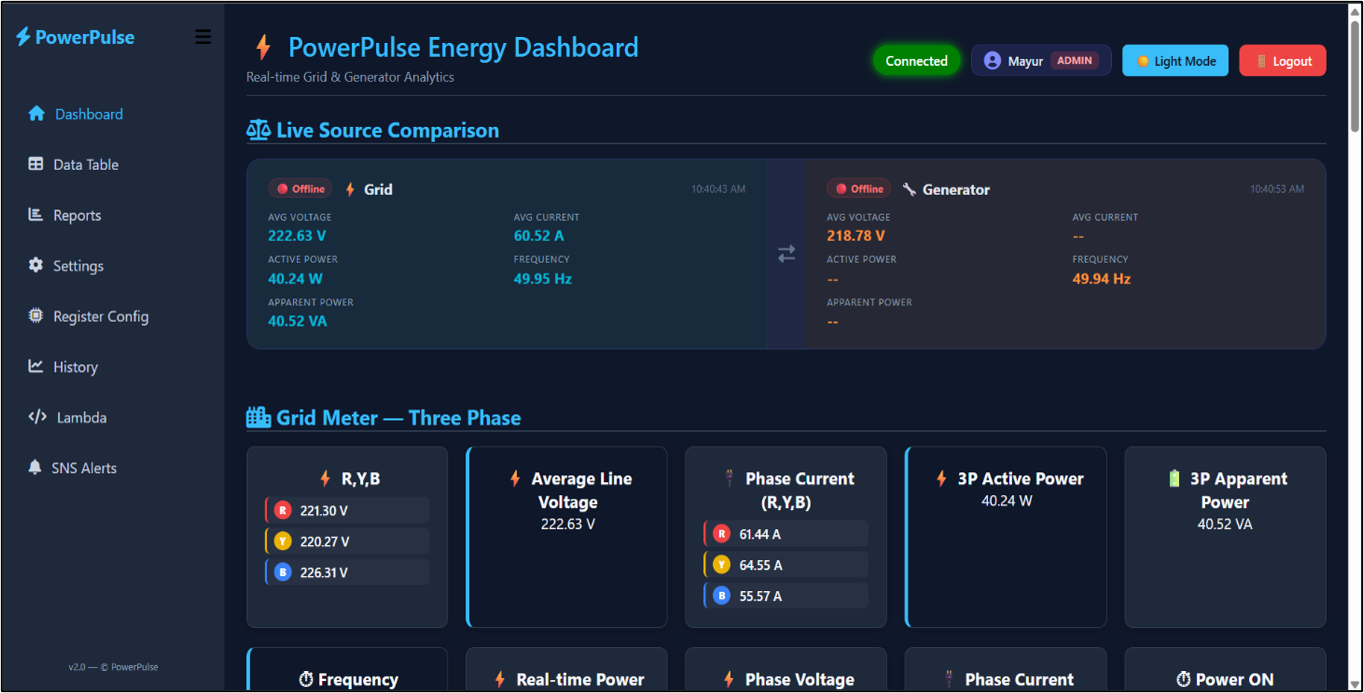
PowerPulse is a cloud-enabled platform for collecting and visualizing real-time electrical energy data from multifunction meters. It provides live source comparison, three-phase meter insights, historical analytics and reporting for efficient energy management.

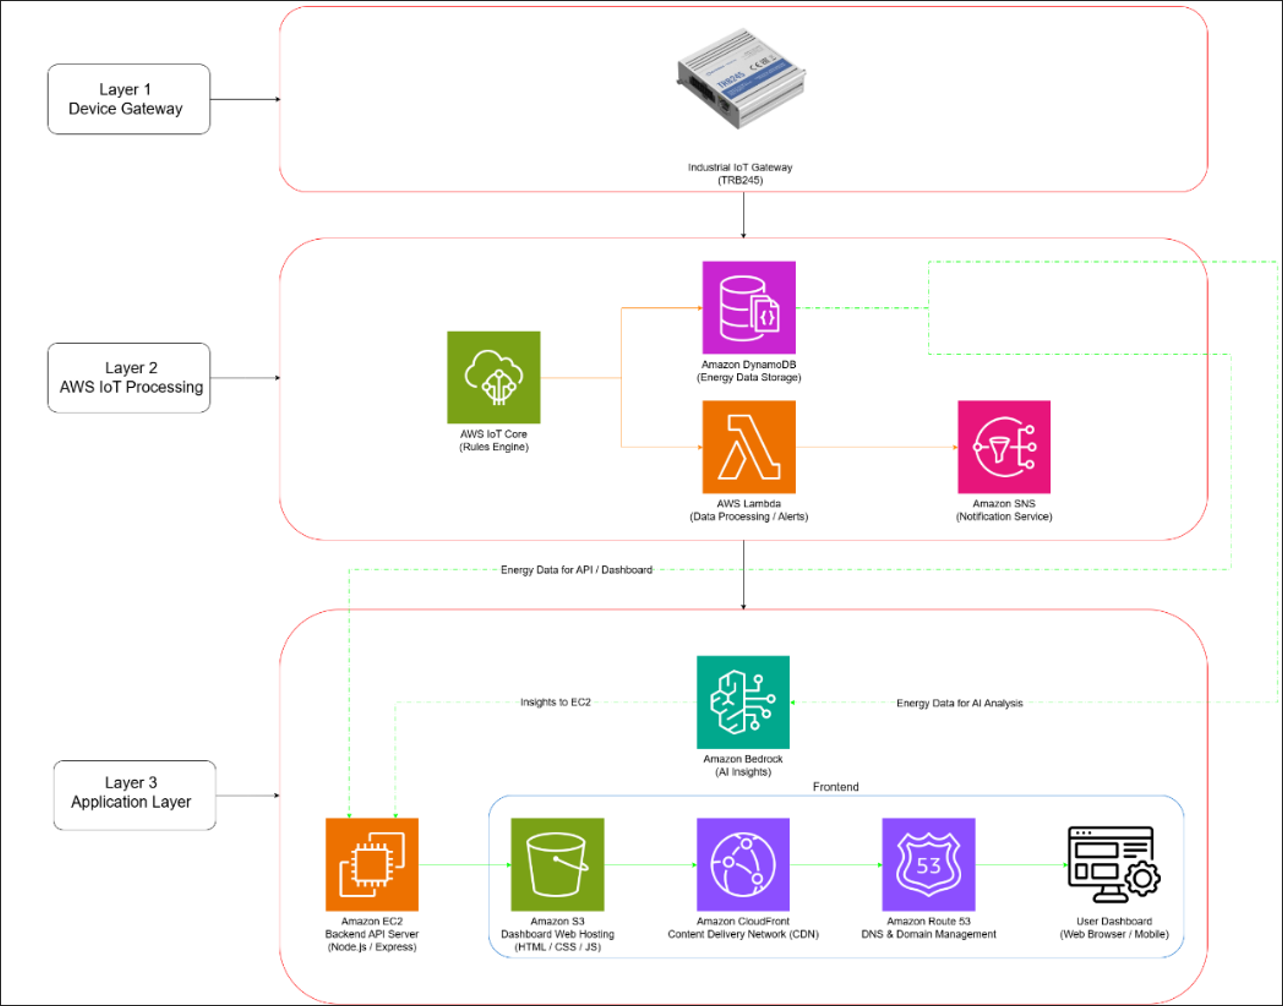
PowerPulse cloud system architecture
System Architecture — Device gateway, AWS processing services, and application layer working together.
PowerPulse dashboard with administrator access
Admin Dashboard Access — Administrative controls for managing the PowerPulse dashboard.
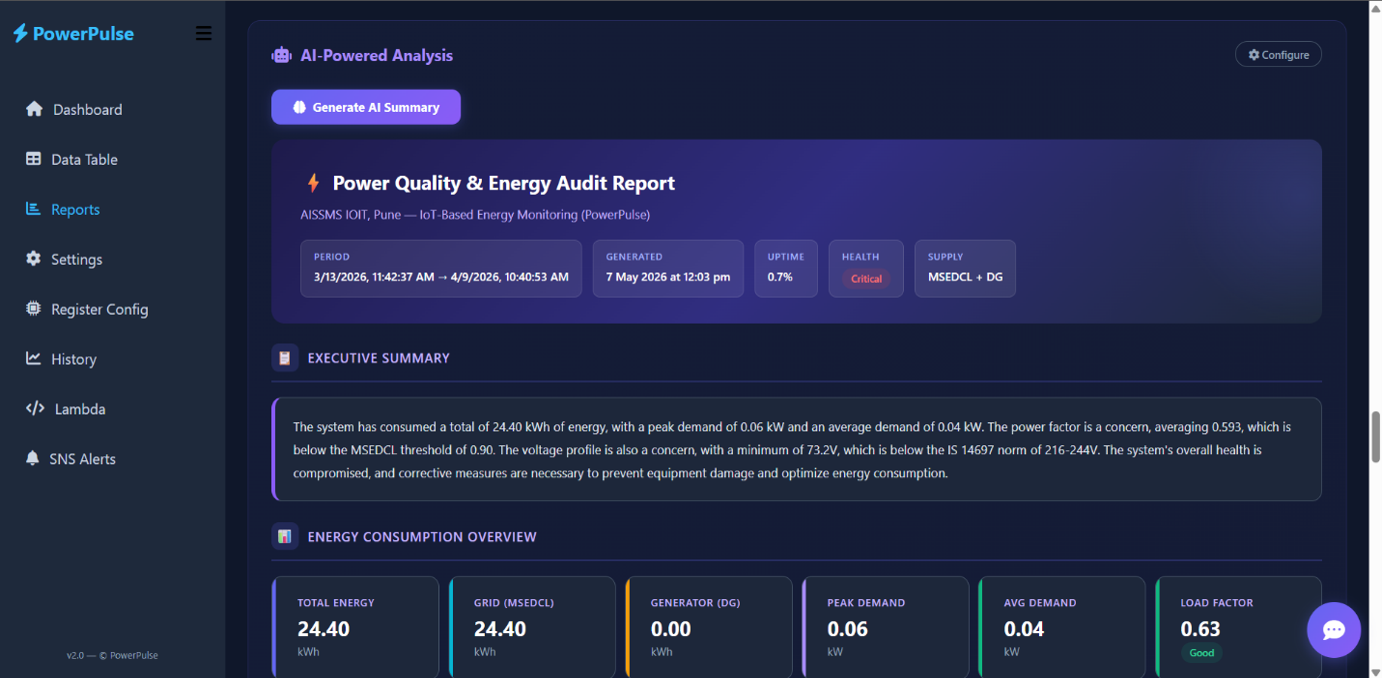
AI-based power quality summary report in PowerPulse
AI-Based Power Quality Summary — Intelligent analysis of power quality data and energy insights.
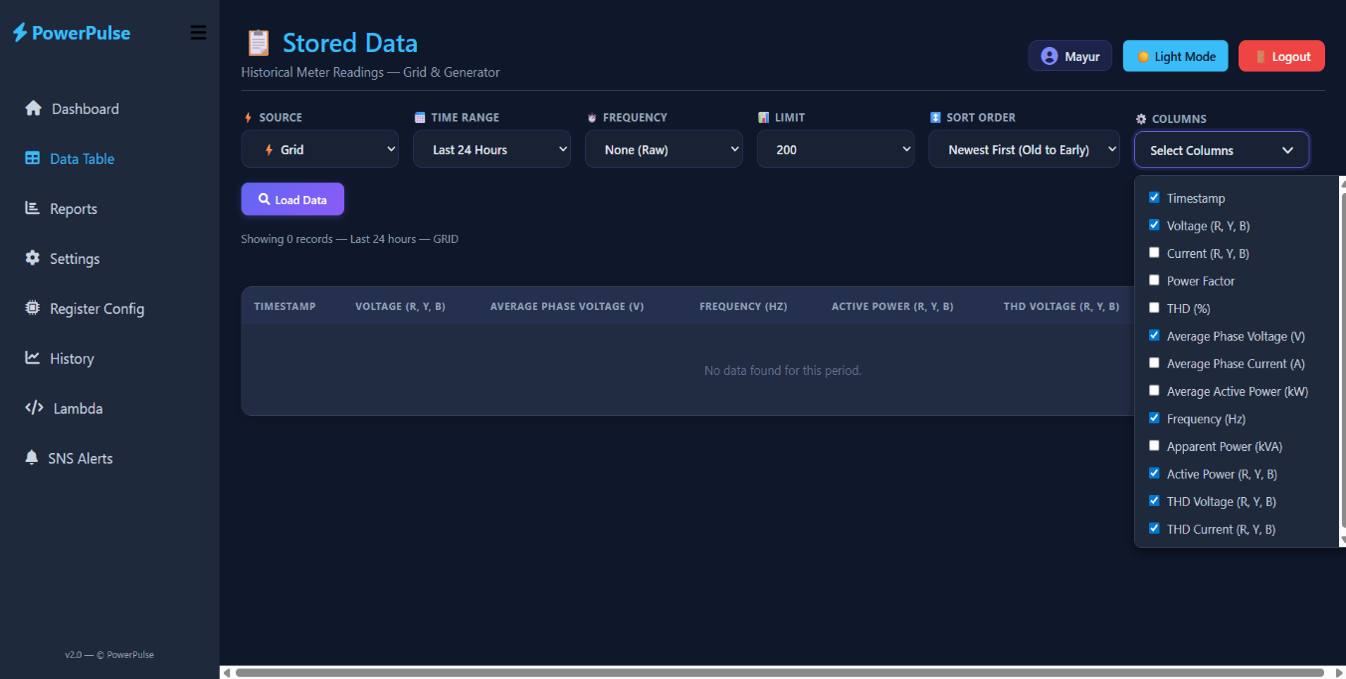
Data table interface with dynamic column selection
Flexible Data Table — Historical energy records with dynamic column selection.
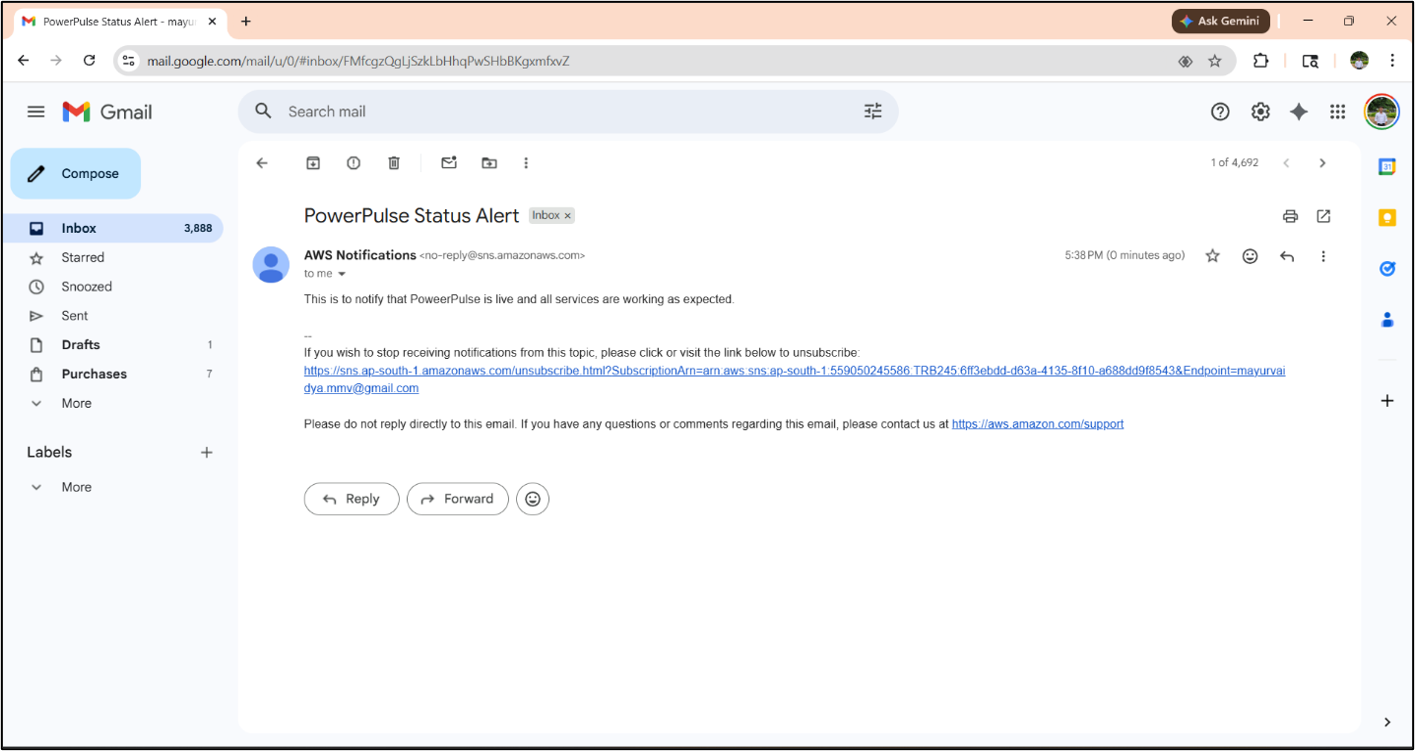
AWS SNS email alert generated by PowerPulse
AWS SNS Email Alert — Instant notification generated when an abnormal condition is detected.
Historical data logging interface for downtime incidents
Historical Data Logging — Stored energy and downtime incident records for later analysis.
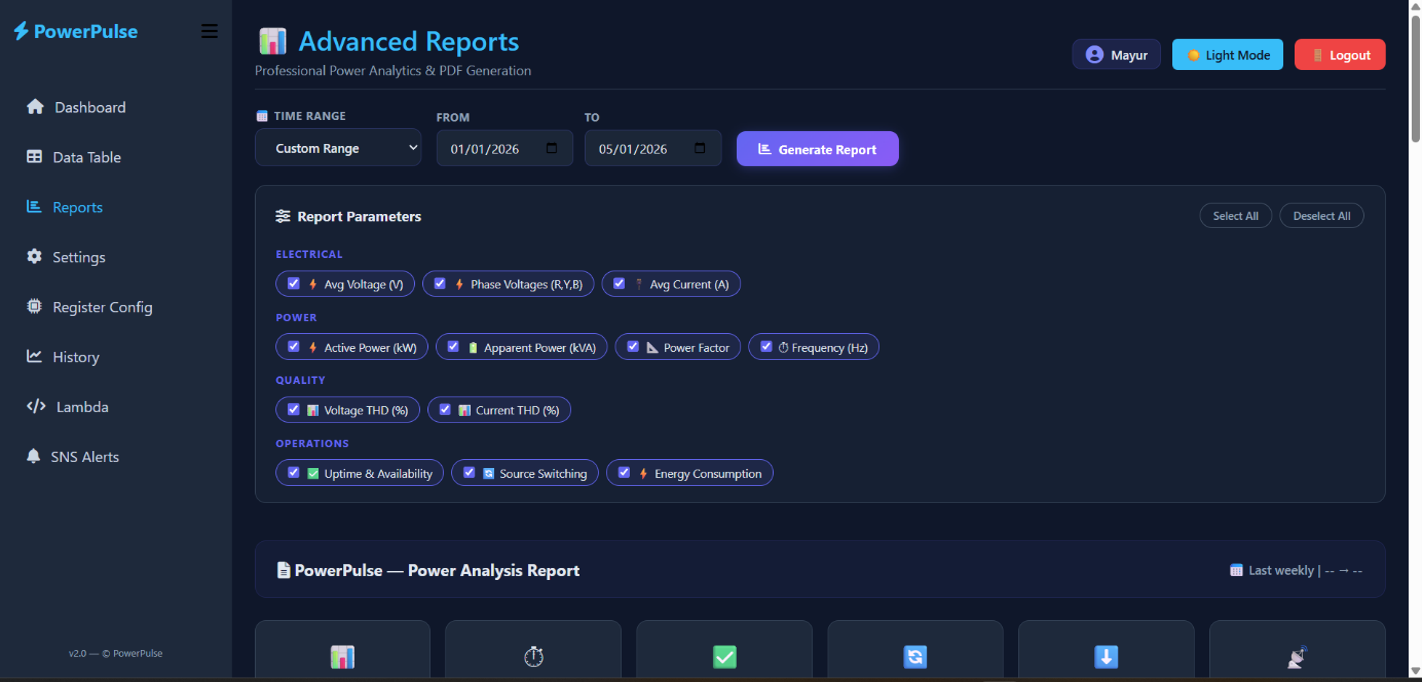
Reports interface with date range selection
Reports by Date Range — Generate and review energy reports for a selected period.
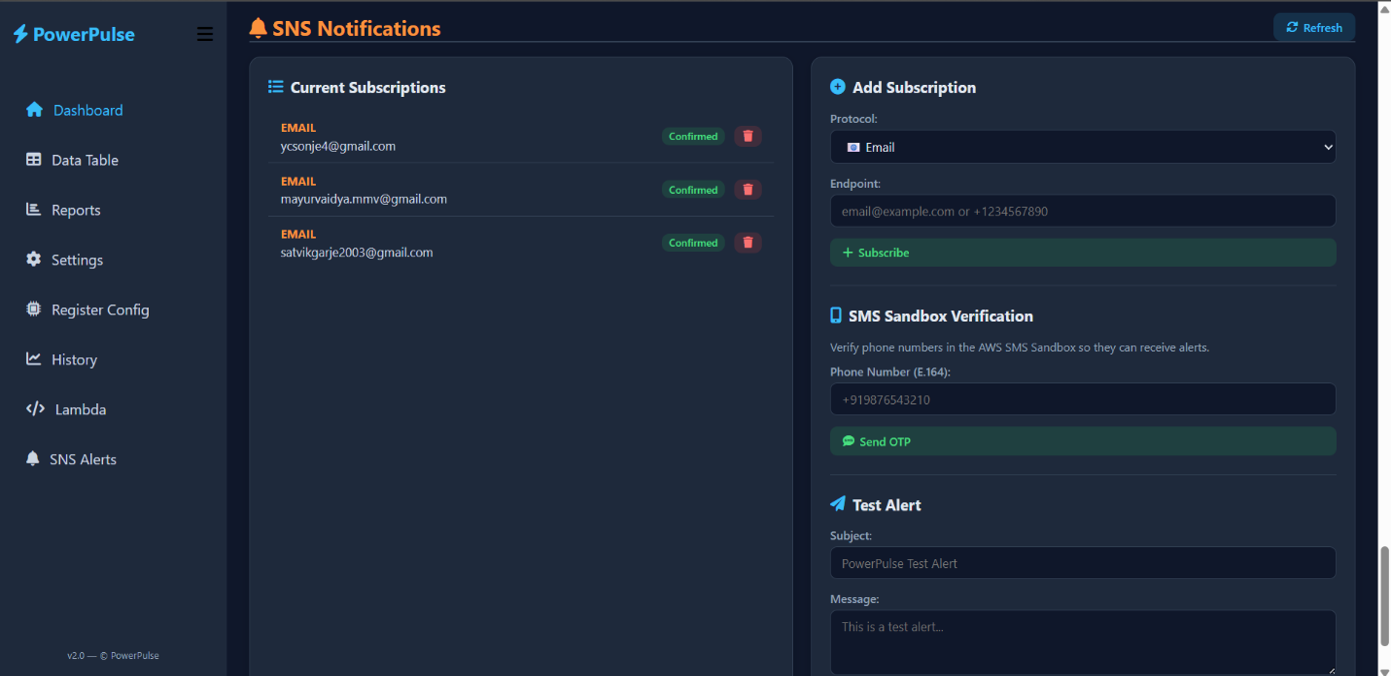
Confirmed AWS SNS email subscriptions in the PowerPulse dashboard
Confirmed SNS Subscriptions — Dashboard view of configured email alert recipients.
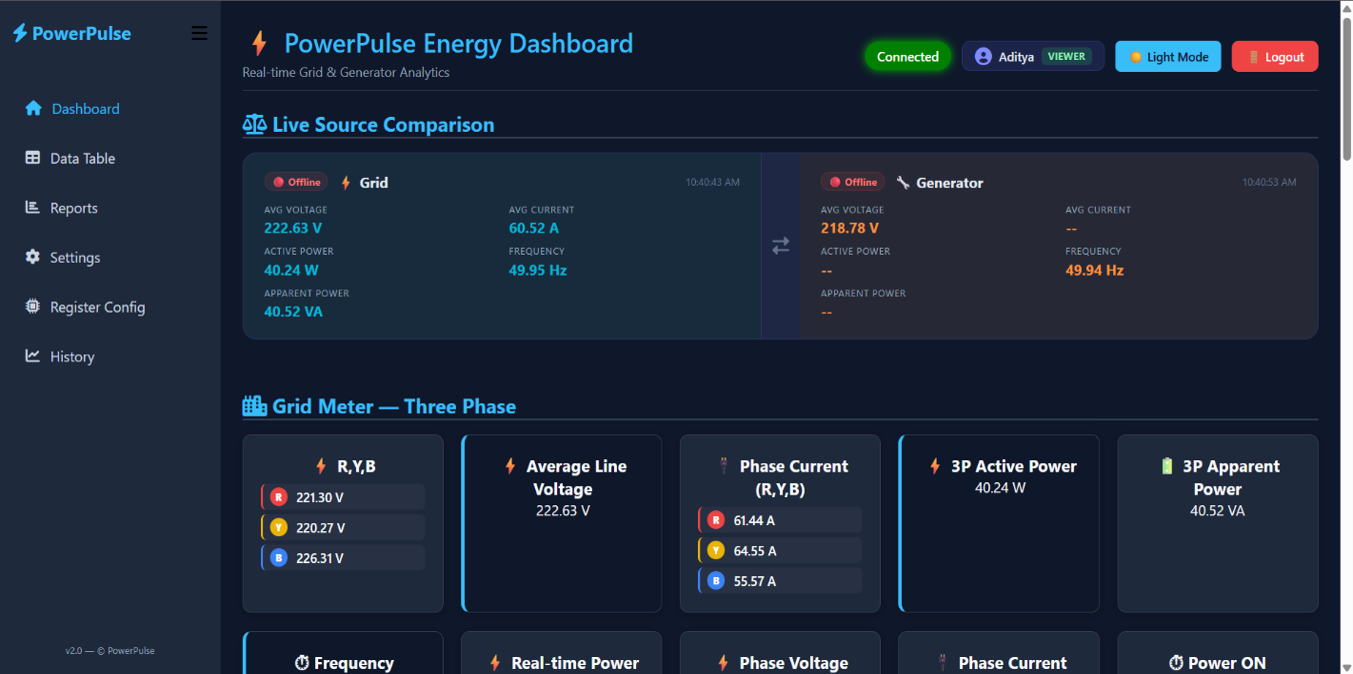
PowerPulse dashboard with viewer access
Viewer Dashboard Access — Read-only access for monitoring energy information securely.

Use the arrows or dots to browse project screenshots.

About Project

PowerPulse – Cloud-Based Smart Energy Monitoring Platform

PowerPulse is my Final Year B.Tech project developed to build a centralized, cloud-based platform for real-time energy monitoring and analytics. The system is designed to monitor and compare energy consumption between the College Grid Supply (MSEDCL) and the Diesel Generator (DG) using industrial smart energy meters.

An Industrial IoT Gateway (TRB245) collects real-time electrical parameters from both meters and securely transmits the data to AWS Cloud using the MQTT protocol. The data is processed through AWS serverless services, stored in Amazon DynamoDB, and visualized on an interactive web dashboard for live monitoring and historical analysis.

The platform also supports automated energy report generation, allowing users to analyze historical consumption patterns and compare the performance of Grid and DG power sources. Additionally, Amazon Bedrock is integrated to generate AI-powered insights, helping identify energy usage trends and support better energy management decisions.

PowerPulse demonstrates the practical implementation of Industrial IoT, Cloud Computing, Serverless Architecture, and AI-driven analytics to deliver a scalable, secure, and intelligent energy monitoring solution.

Key Highlights

  • Designed for monitoring College Grid (MSEDCL) and Diesel Generator (DG) energy consumption.
  • Real-time acquisition of electrical parameters from industrial smart energy meters.
  • Secure MQTT-based communication between IoT Gateway and AWS Cloud.
  • Serverless data processing using AWS Lambda.
  • Historical energy data storage with Amazon DynamoDB.
  • AI-powered energy insights using Amazon Bedrock.
  • Automated energy report generation and historical analysis.
  • Instant alert notifications using Amazon SNS.
  • Interactive web dashboard for real-time visualization and source-wise comparison.
  • Scalable, secure, and cloud-native architecture built on AWS.

About Architecture

Three-Layer Cloud-Based Architecture

PowerPulse follows a three-layer cloud architecture that provides secure data collection, efficient processing, scalable storage, and intelligent visualization of industrial energy data.

Layer 1 – Device Gateway

An Industrial IoT Gateway (TRB245) connects to smart energy meters through industrial communication protocols. It collects real-time electrical parameters and securely publishes telemetry to AWS IoT Core over MQTT, bridging field devices and cloud infrastructure.

Layer 2 – AWS IoT Processing

AWS IoT Core receives telemetry while the IoT Rules Engine filters and routes messages. AWS Lambda validates and processes data, Amazon DynamoDB stores real-time and historical records with low latency, and Amazon SNS delivers instant abnormal-condition notifications. Together, these services provide a fully managed, scalable, serverless processing backend.

Layer 3 – Application Layer

Node.js and Express.js APIs run on Amazon EC2. Amazon Bedrock generates AI-powered energy insights, while Amazon S3 hosts the frontend, CloudFront accelerates delivery, and Route 53 manages DNS. The web dashboard presents live monitoring, historical trends, charts, and AI-generated recommendations.

Technology Stack

Cloud Services
AWS IoT Core, AWS IoT Rules Engine, AWS Lambda, Amazon DynamoDB, Amazon SNS, Amazon EC2, Amazon Bedrock, Amazon S3, Amazon CloudFront, Amazon Route 53
Backend
Node.js, Express.js, REST API
Frontend
HTML, CSS, JavaScript, Chart.js
Database
Amazon DynamoDB
Communication
MQTT, Modbus RTU (RS-485)
IoT Device
Industrial IoT Gateway (TRB245)